Dulwich Streetspace data dashboard
Please note the following regarding the data contained within this dashboard
Data below is that collected from permanent Automatic Traffic Counts (ATCs). ATCs occasionally fail to collect data or under-report volumes. Where no data was collected, gaps appear in charts, and averages are based on data that was collected in a given week or month.
No adjustment has been made for periods where ATCs may have under-reported volumes. No corrections or adjustments have been made to data, for example relating to school holidays or reduced traffic due to lockdowns.
Traffic has been rising across Southwark since the end of the 2021 COVID-19 lockdown, and was at 93% of pre-COVID levels in April 2022 at count points in the north of the borough, and above pre-COVID levels on the TfL network near Dulwich.
Should you wish to have this data in accessible format, please contact the council at: highways@southwark.gov.uk
Latest Month (June 2023) - Comparison to pre-COVID
| site | month | Percentage change compared to Pre-Covid levels (%) | Percentage change compared to June 2022 (%) | |
|---|---|---|---|---|
| 1 | Burbage Road N | 2023-06 | 10.2% | -0.1% |
| 2 | Croxted Road | 2023-06 | -32.5% | -15.4% |
| 3 | Dulwich Village N | 2023-06 | -19.2% | -4.7% |
| 4 | East Dulwich Grove C | 2023-06 | -16.5% | 13.8% |
| 5 | East Dulwich Grove E | 2023-06 | 34.7% | 22.5% |
| 6 | East Dulwich Grove S | 2023-06 | 11.1% | 0.4% |
| 7 | Half Moon Lane | 2023-06 | -27.4% | 4.1% |
| 8 | Townley Road | 2023-06 | -1.1% | 17.1% |
| 9 | Turney Road E | 2023-06 | nan% | -4.3% |
| 10 | Turney Road W | 2023-06 | nan% | -34.5% |
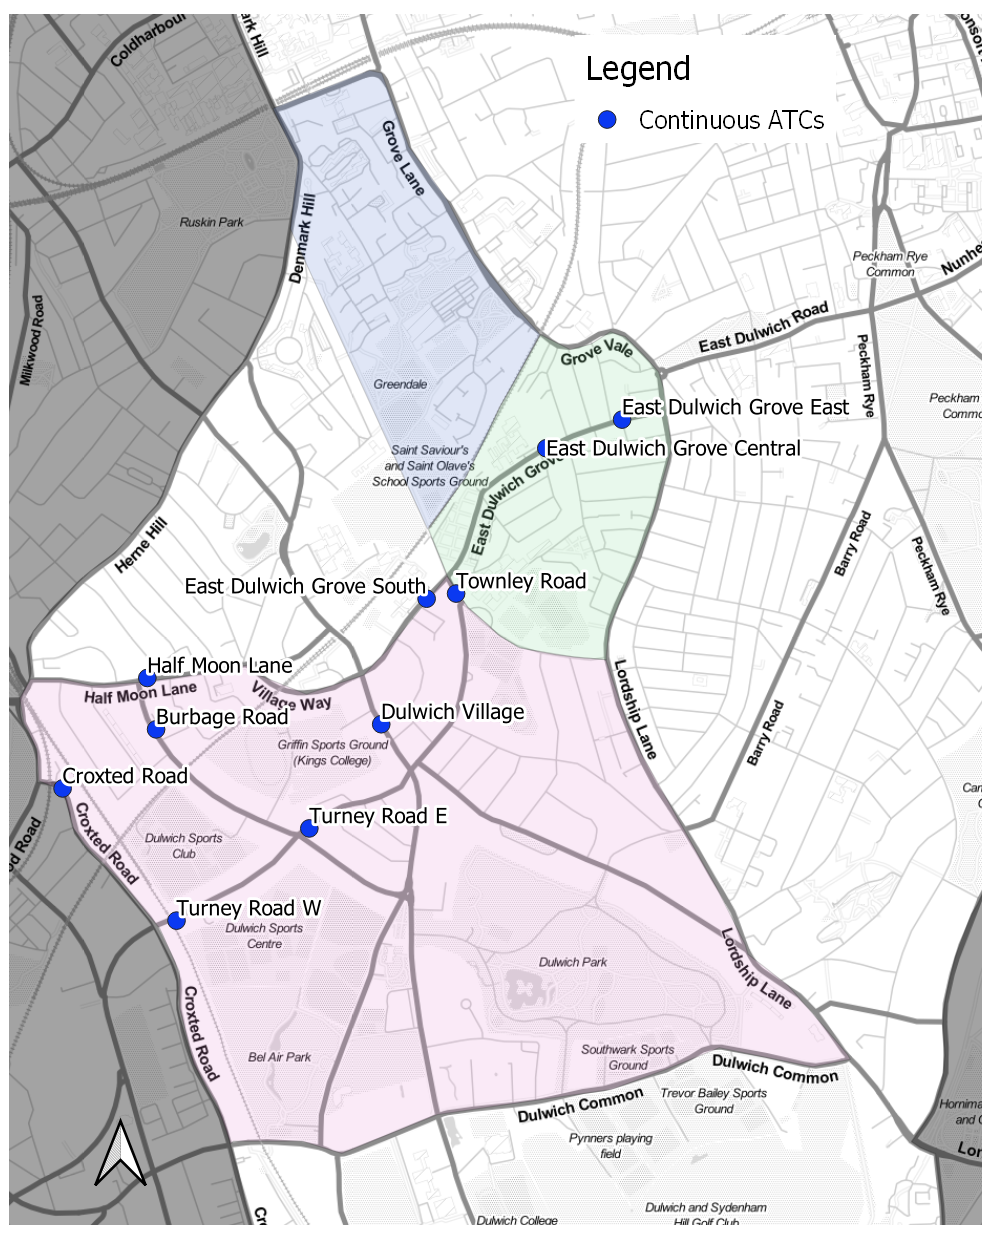
Geographical Context of Surveyed Sites
Traffic Data Analysis - Interactive Charts
Produced by SYSTRA UK Ltd on behalf of Southwark Borough Council
Page last updated: 16 February 2024